
The Fault Lines
Over a century of major earthquakes replayed on a loop: their pulses trace, without needing to be told to, the boundaries of the tectonic plates.
Since the early twentieth century, seismographs worldwide have precisely recorded the magnitude and location of every major earthquake. This world map replays, on a continuous loop, over a century of these earthquakes (magnitude 6 and above), each pulsing at the real moment it occurred.
In the background, a thin line traces the known boundaries of the tectonic plates, established independently through geophysics. The two aren’t a coincidence: nearly all major earthquakes cluster along these boundaries, the most visible and continuous evidence of the plates that make up the Earth’s crust moving against one another.
Show the data as a table
| Decade | Earthquakes | Magnitude 7 or more | Magnitude 8 or more | Strongest earthquake |
|---|---|---|---|---|
| 1900-1909 | 350 | 155 | 9 | 1906 Ecuador-Colombia Earthquake, M 8.8 |
| 1910-1919 | 684 | 146 | 12 | 1918 Mindanao, Philippines Earthquake, M 8.3 |
| 1920-1929 | 966 | 132 | 8 | 94 km ENE of Vallenar, Chile, 1922, M 8.5 |
| 1930-1939 | 1,073 | 129 | 6 | 1938 Banda Sea Earthquake, M 8.5 |
| 1940-1949 | 964 | 130 | 11 | The 1946 Unimak Island, Alaska Earthquake, M 8.6 |
| 1950-1959 | 1,296 | 98 | 7 | 89 km ESE of Petropavlovsk-Kamchatsky, Russia, 1952, M 9.0 |
| 1960-1969 | 1,267 | 136 | 11 | 1960 Great Chilean Earthquake (Valdivia Earthquake), M 9.5 |
| 1970-1979 | 1,093 | 127 | 6 | 1977 Sumba, Indonesia Earthquake, M 8.3 |
| 1980-1989 | 1,257 | 110 | 4 | 25 km WSW of Valparaíso, Chile, 1985, M 8.0 |
| 1990-1999 | 1,530 | 154 | 6 | 48 km E of Shikotan, Russia, 1994, M 8.3 |
| 2000-2009 | 1,585 | 143 | 13 | 2004 Sumatra - Andaman Islands Earthquake, M 9.1 |
| 2010-2019 | 1,493 | 160 | 11 | 2011 Great Tohoku Earthquake, Japan, M 9.1 |
| 2020-2026 | 895 | 95 | 4 | 2025 Kamchatka Peninsula, Russia Earthquake, M 8.8 |
| 1900-2026 | 14,453 | 1,715 | 108 | 1960 Great Chilean Earthquake (Valdivia Earthquake), M 9.5 |
Data sources
Download the prepared data: earthquakes.json (2 MB)
Files as the visualization uses them. Reuse remains subject to the licenses of the sources above.
Related visualizations
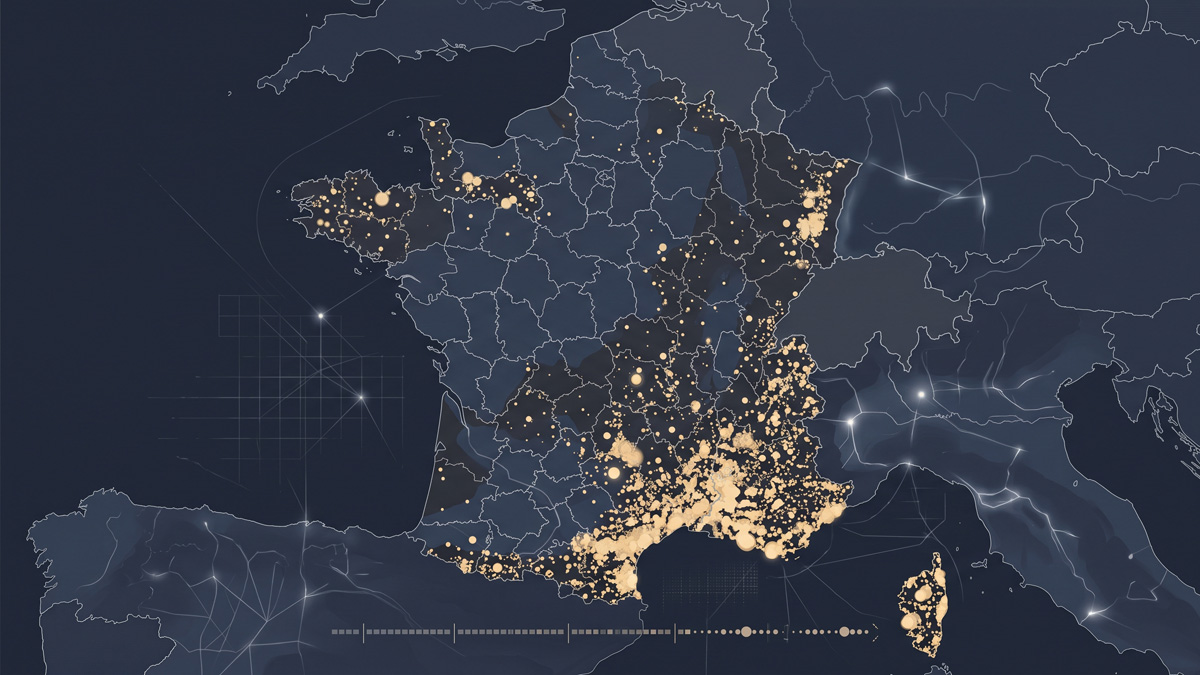
Where France Has Burned
Over fifty thousand forest fires recorded since 2006: a map replaying them, year by year, across the country.
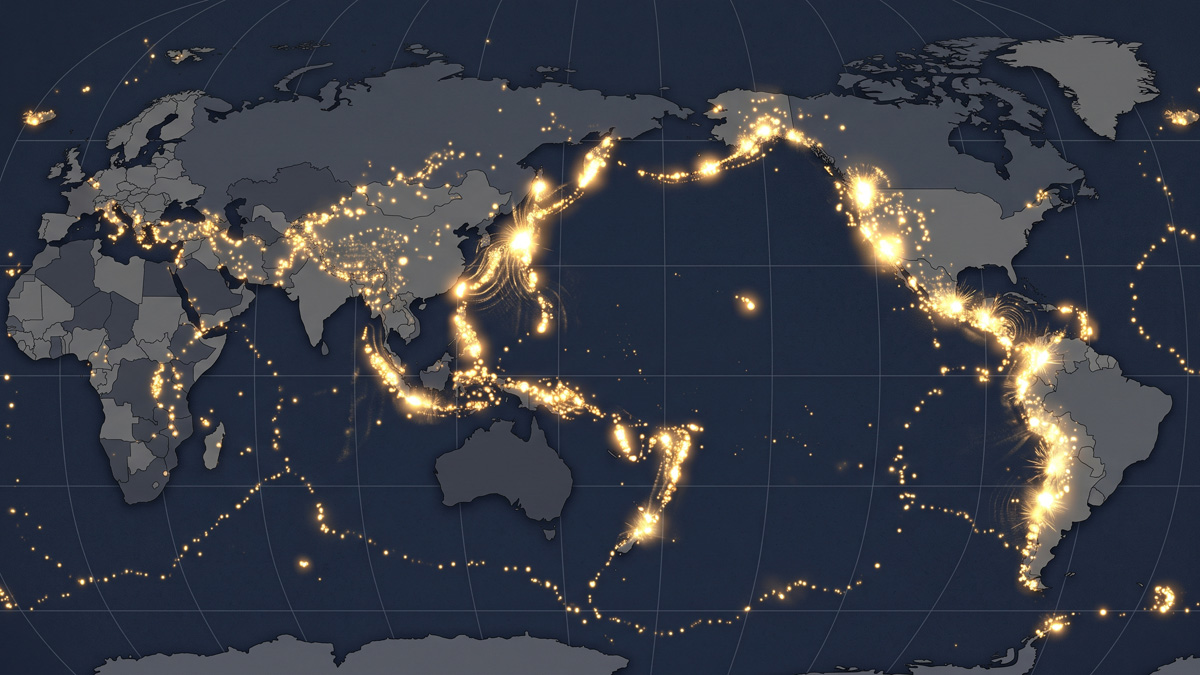
The Pulse of the Earth
Ten thousand years of volcanic eruptions replayed on a loop: the Earth has never stopped shaking, the ring of fire barely visible at rest.
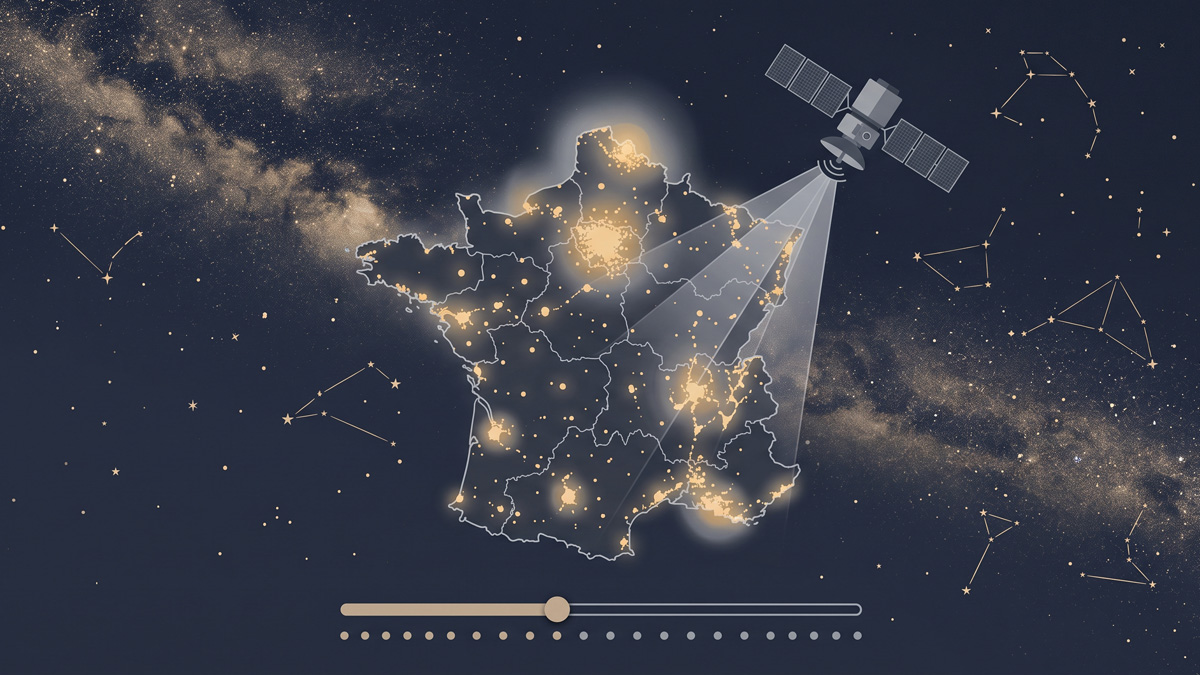
The Sky, Year by Year
Since 2013, satellites have measured the artificial light emitted from the ground across France each year: what you can still hope to see in the night sky, region by region.