
The Sky, Year by Year
Since 2013, satellites have measured the artificial light emitted from the ground across France each year: what you can still hope to see in the night sky, region by region.
Every night, American satellites measure the artificial light emitted from the ground. This data, collected by NOAA’s VIIRS program, tracks the intensity of nighttime lighting everywhere on Earth, year after year.
This map aggregates these measurements across mainland France, year by year since 2013, translating them into a sky-visibility scale rather than physical units: what you might still hope to see, from a countryside sky where the Milky Way remains visible to an urban sky where only a few dozen stars still pierce through the glow. Move the year slider to see how that intensity has varied, region by region, since 2013.
Show the data as a table
| Year | Pristine sky, Milky Way clearly visible | Rural sky, faint distant glow | Suburban sky, Milky Way washed out | Urban sky, glow dominates | City sky, only a few dozen stars visible | Inner-city sky, pervasive glow |
|---|---|---|---|---|---|---|
| 2013 | 26% | 23% | 22% | 18% | 9% | 3% |
| 2014 | 22% | 24% | 24% | 17% | 10% | 3% |
| 2015 | 26% | 23% | 23% | 17% | 9% | 3% |
| 2016 | 27% | 23% | 22% | 17% | 9% | 3% |
| 2017 | 23% | 25% | 24% | 17% | 9% | 3% |
| 2018 | 25% | 24% | 24% | 16% | 9% | 3% |
| 2019 | 27% | 22% | 24% | 16% | 9% | 2% |
| 2020 | 27% | 23% | 23% | 17% | 9% | 2% |
| 2021 | 28% | 24% | 21% | 17% | 9% | 2% |
| 2022 | 30% | 24% | 20% | 16% | 8% | 2% |
| 2023 | 41% | 24% | 18% | 10% | 6% | 1% |
| 2024 | 45% | 23% | 16% | 10% | 5% | 1% |
| 2025 | 44% | 23% | 16% | 10% | 5% | 1% |
Data sources
Download the prepared data: skybins.json (343.8 kB)
Files as the visualization uses them. Reuse remains subject to the licenses of the sources above.
Related visualizations
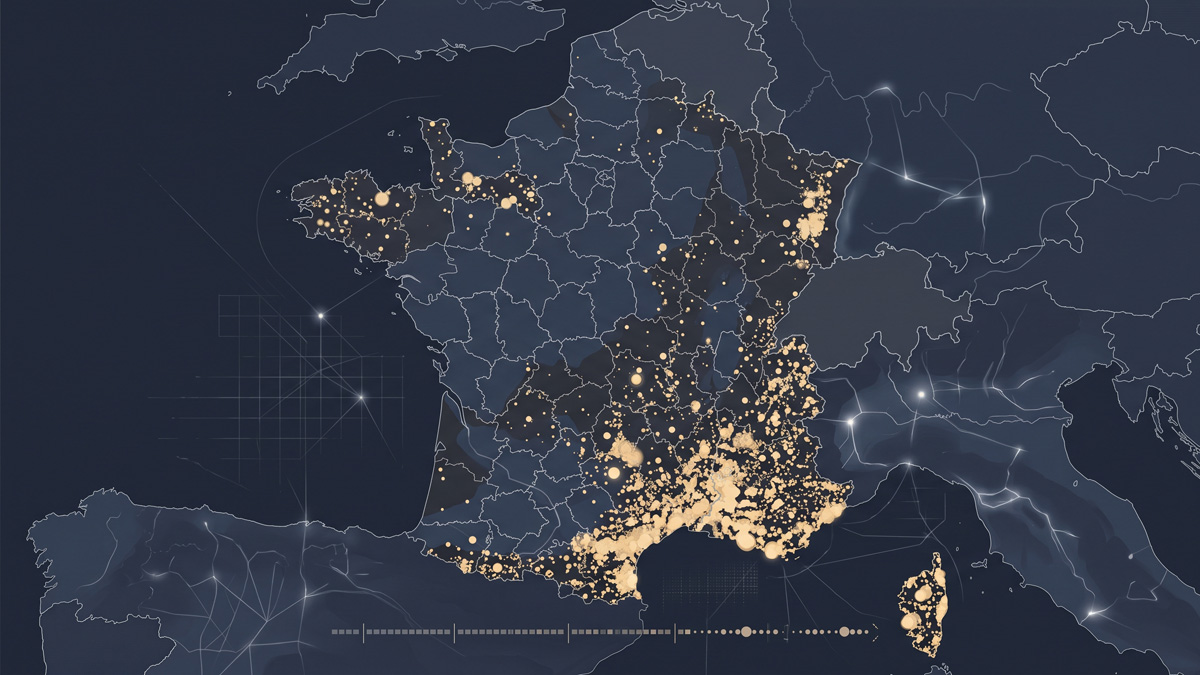
Where France Has Burned
Over fifty thousand forest fires recorded since 2006: a map replaying them, year by year, across the country.
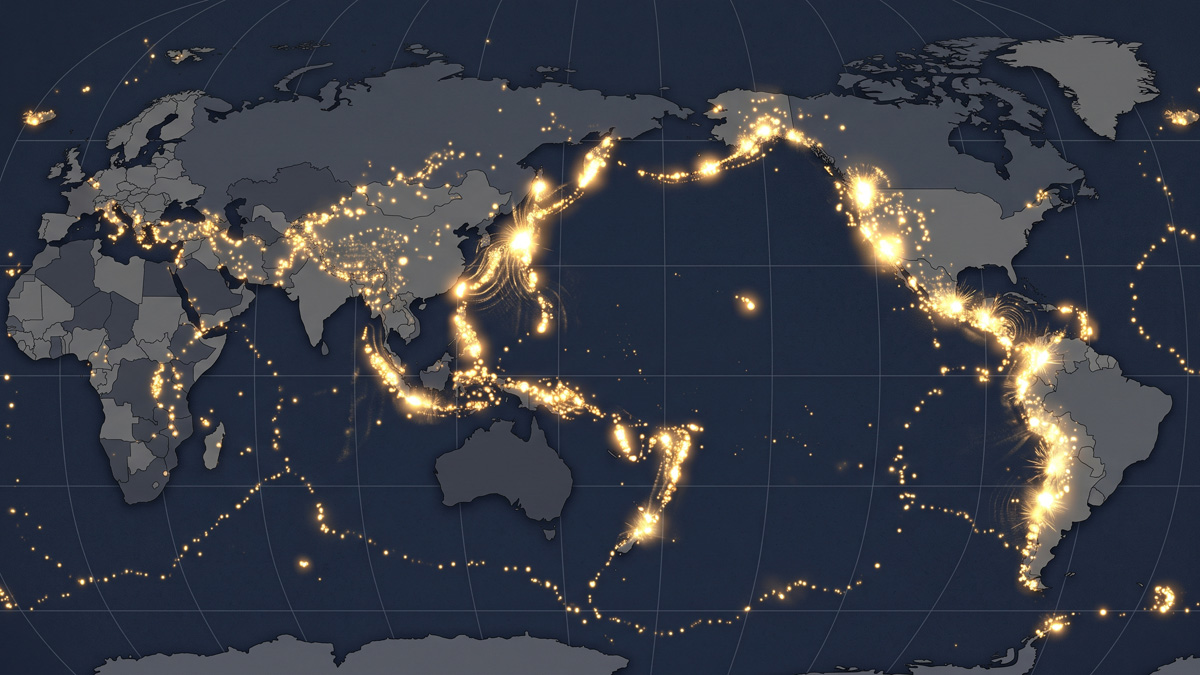
The Pulse of the Earth
Ten thousand years of volcanic eruptions replayed on a loop: the Earth has never stopped shaking, the ring of fire barely visible at rest.
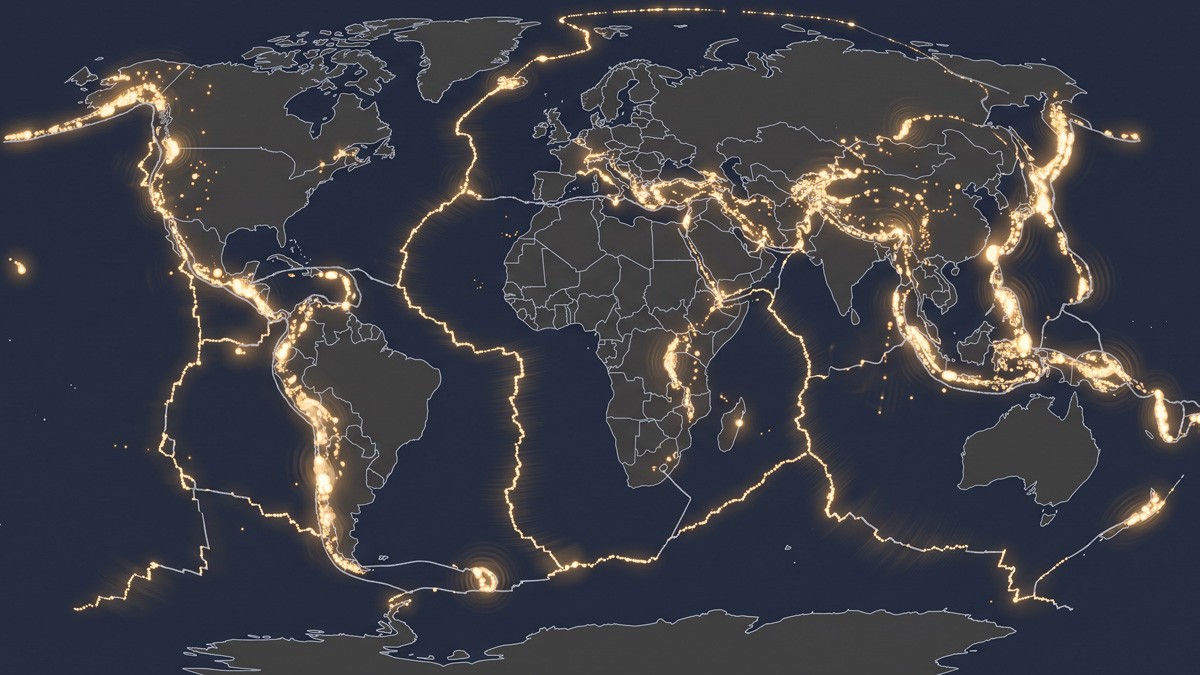
The Fault Lines
Over a century of major earthquakes replayed on a loop: their pulses trace, without needing to be told to, the boundaries of the tectonic plates.